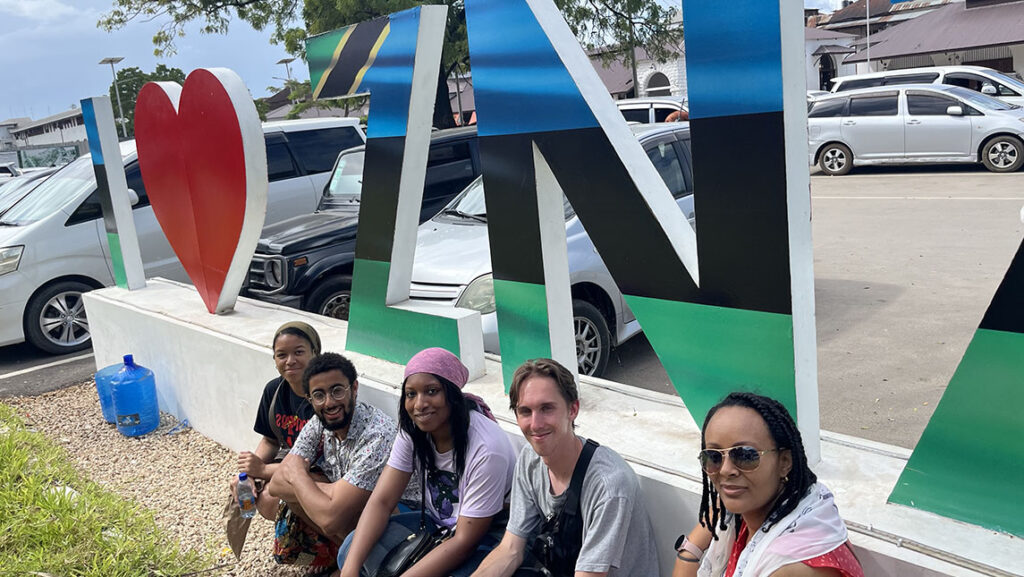
This summer, six undergraduate and two graduate students will travel to Tanzania on a three-week study abroad adventure offered by the UNC Greensboro African American & African Diaspora Studies (AADS) program and the Lloyd International Honors College, in collaboration with the Ethiopian, East African & Indian Ocean Research Network. This is the second year for the program, which began in 2023 with four students.
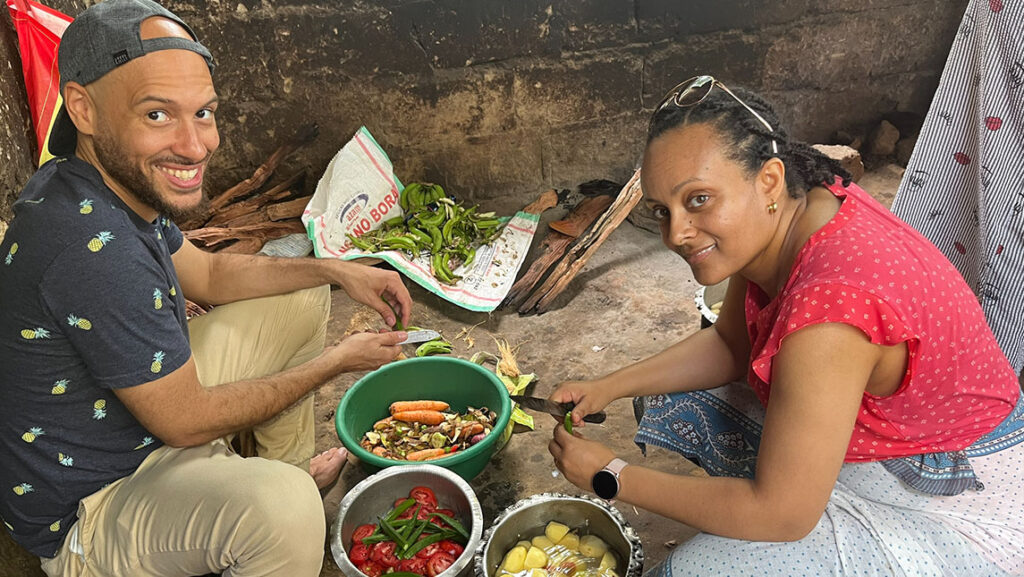
No method of learning about a culture compares to being there, says David Aarons, a faculty director of last year’s trip. “Cooking with the people, feeling the heat of the stove with them, smelling their foods, overhearing their music and how they address each other, doing what they do every day, shows you how to live in the world. It’s not just what you learn, but how you learn it.”
First-time travelers dive into culture
For most participants, this will be their first exposure to East Africa’s Indian Ocean world, according to Hewan Girma, one of two faculty leaders of the trip. “Most of our students in AADS do not often think about the presence of people of African descent outside the Black Atlantic,” she says. “This will give them a very different perspective.” For some, this will be their first time outside the United States.
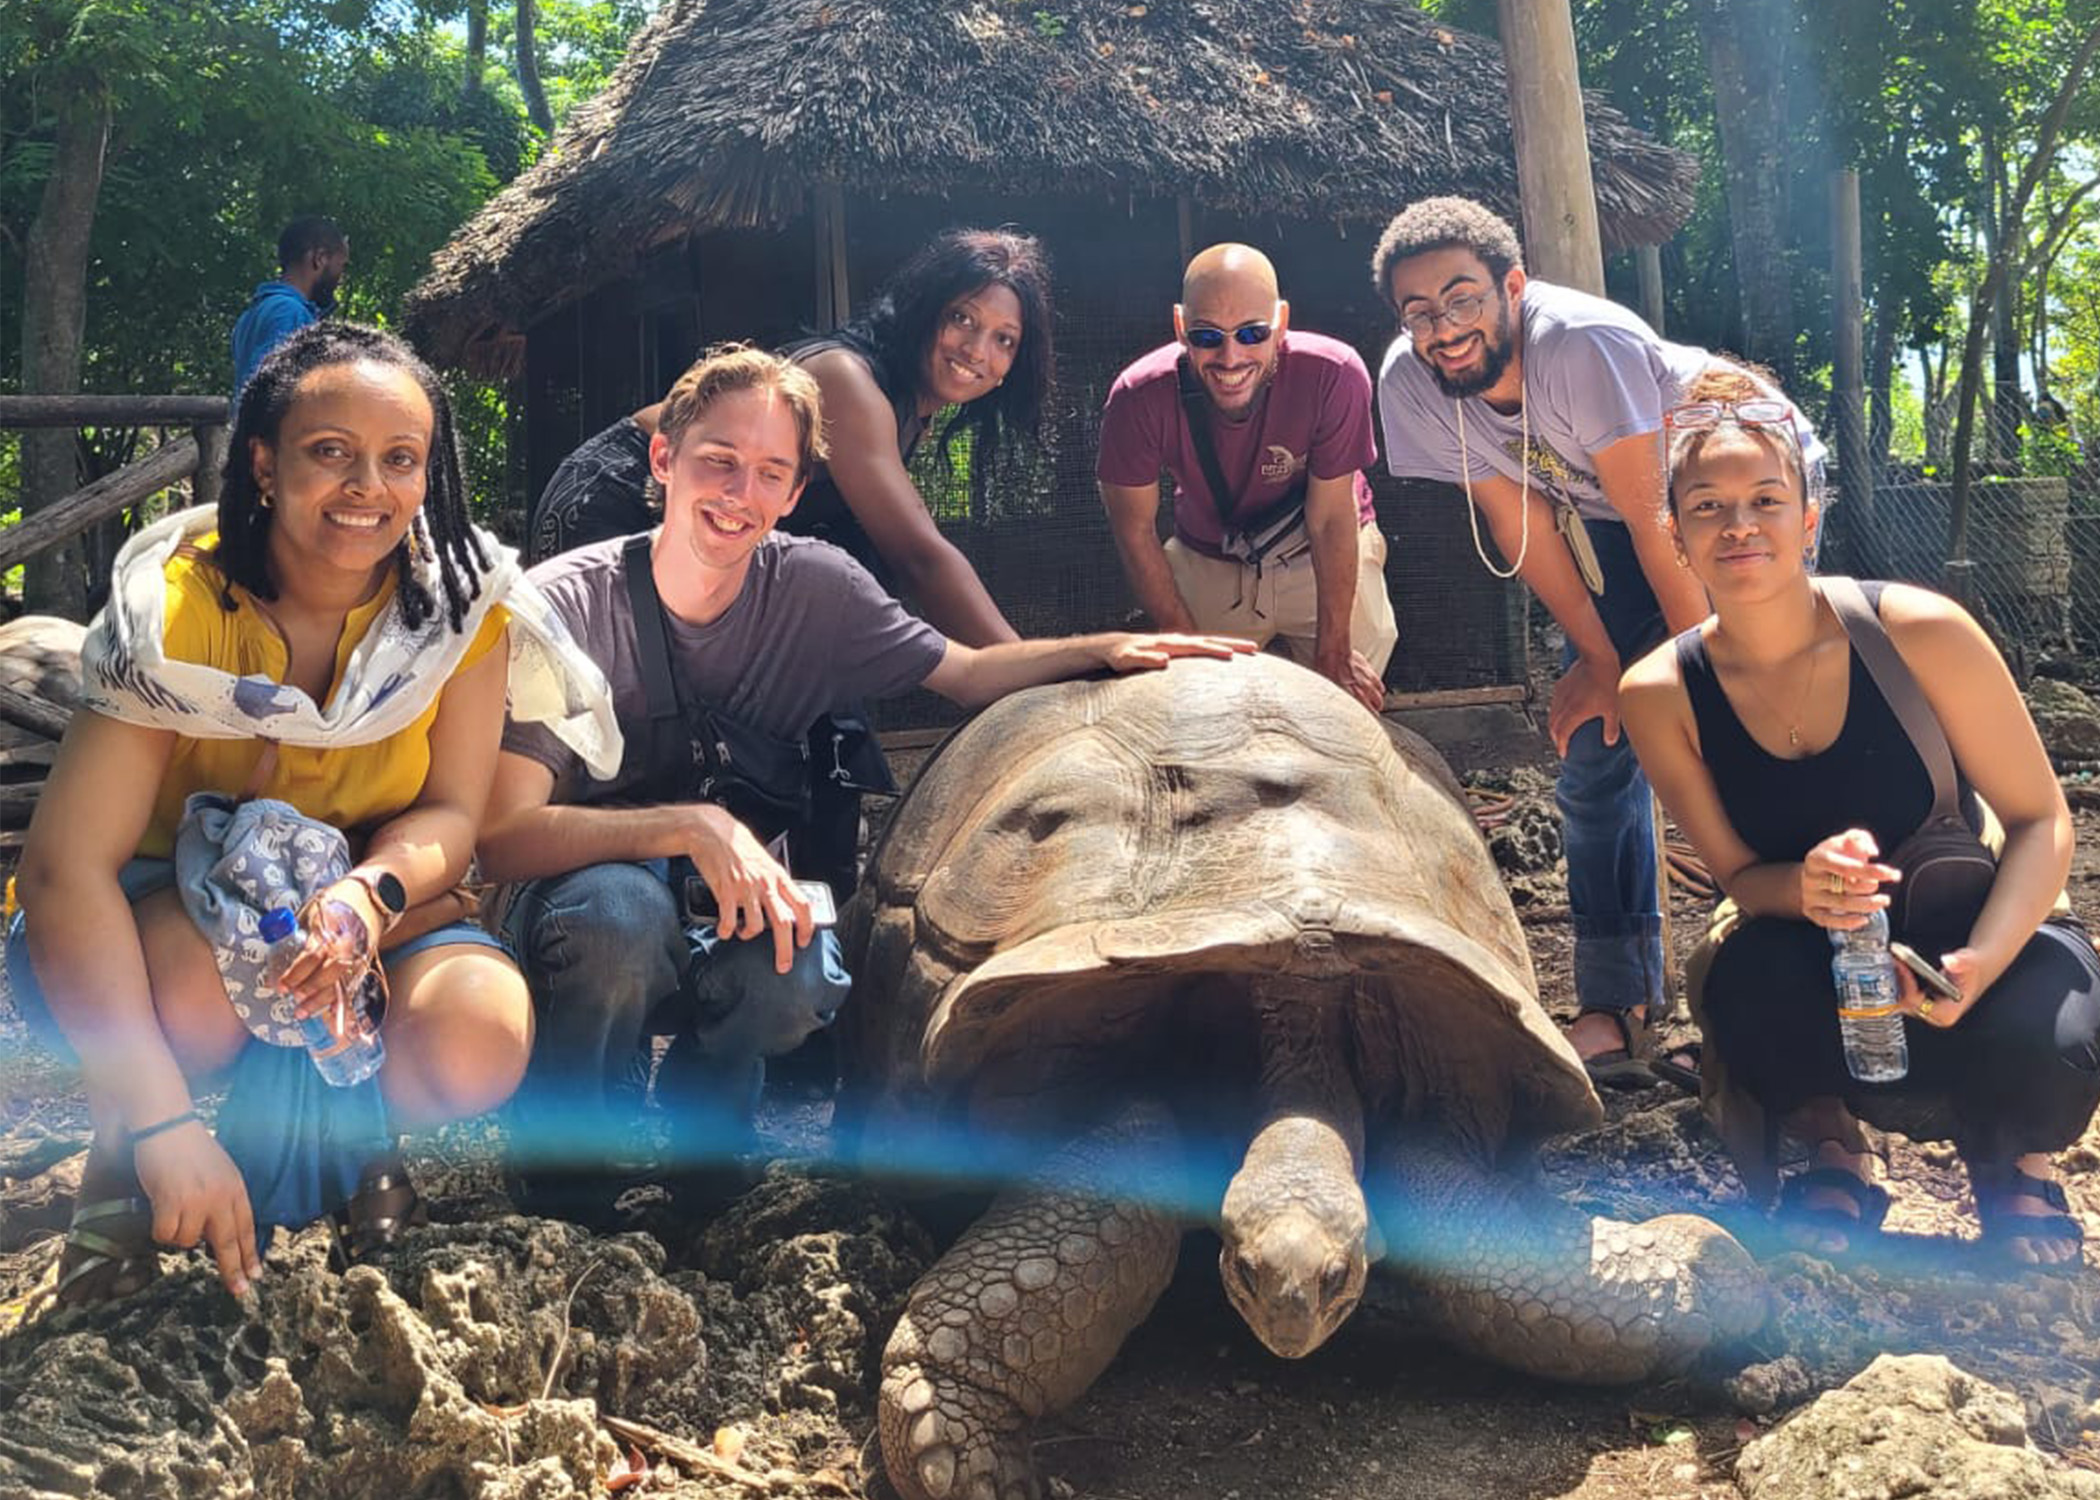
The three weeks will offer a rich overview of the history, language, food, music, and way of life in the region. Plans call for the students to visit Prison Island, home to giant tortoises, as well as the ruins of a former prison and hospital. They will also travel to a spice farm in Zanzibar, with a long history of spice cultivation, including ginger and black pepper. There, they hope to take a cooking class, using local recipes and ingredients.
Other activities include a dhow-building workshop. A dhow is a sailing vessel native to the area and plays “a huge part in local and regional economy,” says Dr. Neelofer Qadir, this year’s other faculty director. Assigned readings will cover historical and contemporary uses of the boats and the historical legacies of exchange between Africa and Asia on the East African Coast. Students will also examine navigational poems in Swahili and Arabic languages that sailors used in the 17th, 18th, and 19th centuries to make navigational maps.
On mainland Tanzania, the group will observe the International African Court on Human and Peoples’ Rights, based in Arusha to ponder the history, language, and role of human rights as tried in courts on the continent. “This is the court where many of the hearings for the genocide in Rwanda took place,” says Girma.
Arusha, the starting point for a lot of safari trips, is near Mount Kilimanjaro. “We think it’s great that the students can move between rural space and city space,” Qadir adds.
A trip to Stone Town of Zanzibar, a centuries-old Swahili trading town, will give a “sense of what urban life looks like in an old port city,” says Qadir. Stone Town is a UNESCO heritage site, meaning it is protected from certain types of building and alteration. The site includes ancient mosques and palaces.
In addition, Qadir hopes the group can attend lectures and workshops of the Dhow Countries Music Academy to learn about the local music scene historically and in the present.
A life-changing experience
During the three weeks, students also have time to catch up on reading, work on assignments, explore on their own or in pairs, and relax. They keep a journal of what they see and how they interact with people and places, and they make a collage of images and/or documentary videos that can be shared with their families, friends, and fellow students.
The faculty leaders and UNCG make the adventure financially in reach for student participants. “We try to make it as affordable as possible,” she says. “AADS fundraises for it and the Honors College donated generously.” Scholarships are available, too, that cover the full cost.
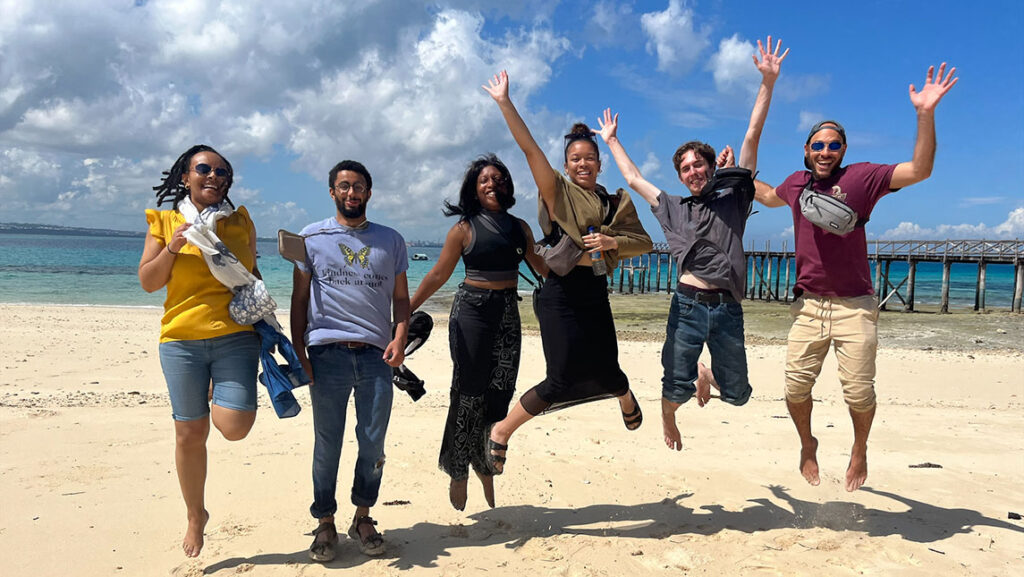
“Being on a guided trip on the African continent, enjoying experiences with other students in a safe environment with knowledgeable faculty expands the way students think about the world outside Greensboro or North Carolina,” Girma says. “It’s a life-changing experience.”
Story by Mary Daily
Photography courtesy of Stephanie Fisher-Huynh